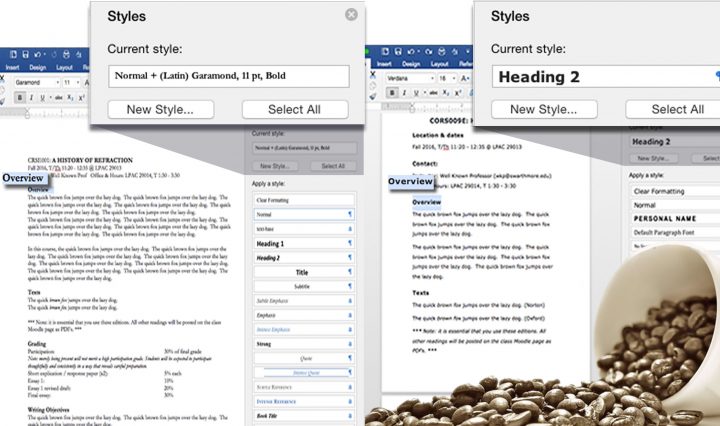
Two Word docs side by side, with and without styles

Formatting Syllabi in Word (or any other Word document)

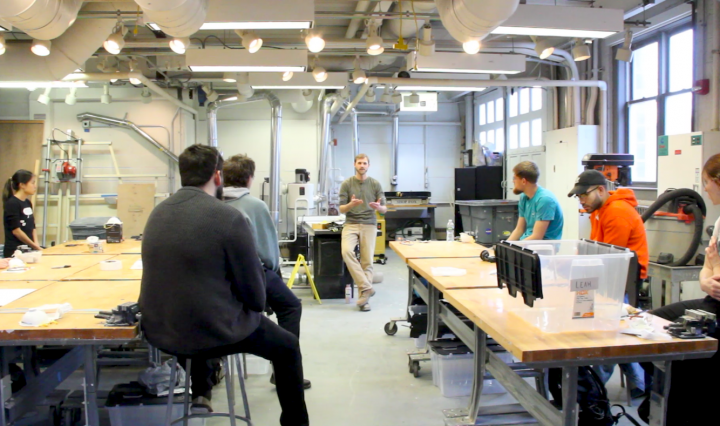
Along with delicious coffee provided by our in-house Coffee Barista, Dave Neal, and scrumptious treats we enjoyed a great conversation at our mini-session which focused on a couple of quick tips for formatting syllabi using Microsoft Word. When we structure … Continue reading Formatting Syllabi in Word (or any other Word document)

Prismatic neural network multicolor brain picture

Back To School Sessions

Although it may seem like the beginning of the 2017-2018 year is a long way off, we’ve already been hard at work planning sessions for the Swarthmore College community.  Whether it’s getting acquainted with your new Windows 10 machine (if … Continue reading Back To School Sessions

Workshop: Creating Instructional Video Using Personal Devices Aug. 22-23

Dates/Times: 10 am – 4 pm, August 22 and 23, Language Center, Kohlberg Hall This workshop is intended for faculty with an interest in creating course, or program related videos. We’ll walk you through the process of conceptualizing, storyboarding, scripting, filming, editing and captioning a video. We’ll encourage you to bring your own camera, record off a phone or personal device and edit using software available to you through the College. You’ll walk away with a finished video that’s ready to use and the skills to replicate the process in the future. This is an opportunity to work on, for … Continue reading Workshop: Creating Instructional Video Using Personal Devices Aug. 22-23

Sneak Peek: Lynda Insights

Since late summer 2013, Swarthmore users have had access to the entire library of Lynda.com videos (found at lynda.swarthmore.edu).  During that time, we’ve had 1284 users watch 47,272 videos for a total of 3397 hours.  Are you missing out? At the time of this post, there are 5755 courses totalling 212,653 video tutorials available, on topics ranging from Gmail to mindfulness to Amazon Web Services to how to play rock guitar.  But what courses and video are most popular? Looking at the 2016-2017 school year, the top five courses are: Premiere Pro CC Essential Training (2015) Revit Structure 2016 Essential Training Java … Continue reading Sneak Peek: Lynda Insights

Data Visualization and Projection

Data visualization involves the presentation of data in a pictorial or graphical format that engages the viewer with information. These visualizations can then be printed, displayed, or projected into spaces to make difficult concepts easier to grasp, reveal patterns that would otherwise be opaque, or provide alternative interpretations of information. They can be used artistically, theatrically or informationally and can change the way people inhabit space. Interactive visualizations may respond to user inputs, or live data feeds and take the concept a step further by allowing you to drill down into charts and graphs for more detail, changing what data … Continue reading Data Visualization and Projection