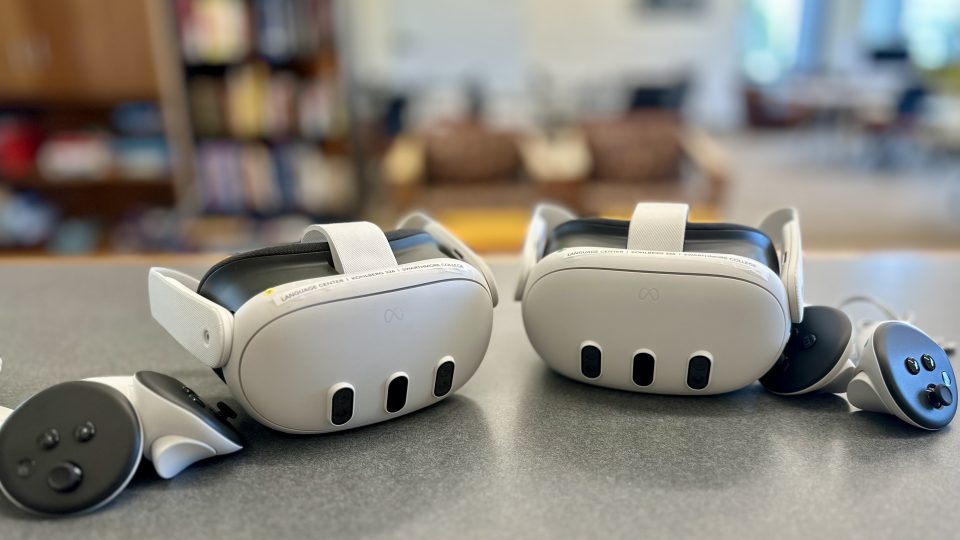
 Link to Extended Reality Resources in the Language Center


New Brown Bag Lunch Series
Given the interest in R amongst the faculty in every division and the increasing use of statistical and graphical analysis that it facilitates, we are now announcing a new series of informal Brown Bag Lunches for Faculty and Staff. (We’ll … Continue reading New Brown Bag Lunch Series

SPEED Project Wrap Up for Summer 2017
At the end of July, ITS and Library staff and student workers completed another set of Swarthmore Projects for Educational Exploration and Development (SPEED). David Molina Cavazos ’20 worked with Assistant Dean Liz Derickson and Associate Director of Client Services Erin Massey, to create firststeps.swarthmore.edu, a site that Swarthmore students and faculty advisors can use to explore majors. Each page contains data collected from alumni to provide guidance on what students do after graduation, sample career paths, and student narratives. The Dean’s Office is using First Steps to assist with course advising this year. Kate Collins ’18 collaborated with Math Professor Elizabeth Drellich to … Continue reading SPEED Project Wrap Up for Summer 2017
What you need to know about the Moodle Update for Fall 2017
Course Listing Your list of courses is now separated into In progress (current), Future, and Past based on the start and end dates of the courses. Click on the appropriate tab to see your courses. Fall courses start on September 4, … Continue reading What you need to know about the Moodle Update for Fall 2017
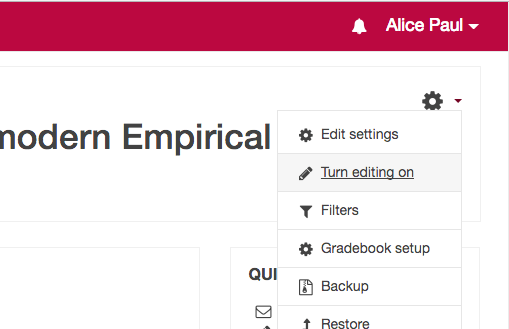
Moodle Updates for Fall 2017
ITS will be updating to Moodle version 3.3 on Wednesday August 16, 2017 from 7-10AM. The new version of Moodle has both aesthetic and functional improvements. The most noticeable change will be the updated theme, which will be more modern and … Continue reading Moodle Updates for Fall 2017
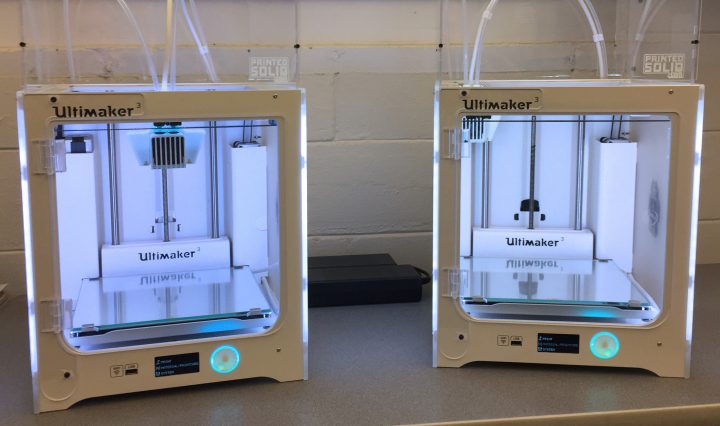
Second New Ultimaker 3 – 3D Printer
Information Technology Services has just acquired a another new 3D printer! In our efforts to make 3D printing available to more folks here at Swarthmore, we’ve acquired a second Ultimaker 3 printer. Since it can take hours to complete a … Continue reading Second New Ultimaker 3 – 3D Printer
Back To School Sessions
Although it may seem like the beginning of the 2017-2018 year is a long way off, we’ve already been hard at work planning sessions for the Swarthmore College community. Whether it’s getting acquainted with your new Windows 10 machine (if … Continue reading Back To School Sessions