From one of my favorite blogs, Stats With Cats by Charlie Kufs:
Category: Survey Research
Tools, techniques, and observations about survey research.
Catching our breath…

It’s hard to believe that this semester is finally drawing to a close. The multitudes of followers to our blog may have noticed our sparse posts this spring… Shifting responsibilities, timing of projects, and just the general “stuff” of IR have left us little time to keep up.
Part of my own busy-ness has been due to an increased focus on assessment, as mentioned in an earlier post. This spring, the Associate Provost and I met with faculty members in each of our departments to talk about articulating goals and objectives for student learning. In spite of our being there to discuss what could rightly be perceived as another burden, these were wonderful meetings in which the participants inevitably ended up discussing their values as educators and their concerns for their students’ experiences at Swarthmore and beyond. In spite of the time it took to plan, attend, and follow-up on each of these meetings, it has been an inspiring few months.
Spring “reporting” is mostly finished. Our IPEDS and other external reports are filed, our Factbook is printed, and our guidebook surveys have been completed (although we are now awaiting the “assessment and verification” rounds for US News). Soon we will capture our “class file” – data reflecting this year’s graduates and their degrees, and that closes the year for freezing and most of the basic reporting of institutional data.
We also are fielding two major surveys this spring, our biennial Senior Survey (my project) and a survey of Parents (Alex’s project). Even though we are fortunate to work within a consortium that provides incredibly responsive technical support for survey administration, the projects still require a lot of preparation in the way of coordinating with others on campus, creating college-specific questions, preparing correspondence, creating population files, trouble-shooting, etc. The Senior Survey is closed, and I will soon begin to prepare feedback reports to others on campus. The Parents Survey is still live, and will keep Alex busy for quite some time.
As we turn to summer and the hope of having a quieter time in which to catch up, we anticipate focusing on our two projects that are faculty grant-funded. We don’t normally work on faculty projects – only when they are closely related to institutional research.
We are finishing our last year of work with the Hughes Medical Institute (HHMI) grant. IR supports the assessment of the peer mentor programs (focusing on the Biology and Mathematics and Statistics Departments) through analysis of institutional and program experience data, and surveys of student participants. We will be processing the final year’s surveys, and then I will be updating and finalizing a comprehensive report on these analyses that I prepared last summer.
Alex is IR’s point person for the multi-institutional Sloan-funded CUSTEMS project, which focuses on the success of underrepresented students in the sciences. Not only does he provide our own data for the project, but he will be working with the project leadership on “special studies,” conducting multi-institutional analyses beyond routine reporting to address special research needs.
I wonder if three months from now I’ll be writing… “It’s hard to believe this busy summer is finally ending!”
Using Everyday Words in Surveys
One of the platitudes maxims I often repeat when I give advice or presentations on survey design goes something like this:
“If you think there are different ways of interpreting a question, chances are that someone will…”
Around the time that I repeat this I also do some carrying on about how even what seem to be the most everyday of words or terms can be interpreted in many different ways. This morning I came across another example that can be added to my harangue on this topic. It is from 2008 but it is new to me:
“When preparing our GSS survey questions on social and political polarization, one of our questions was, ‘How many people do you know who have a second home?’ This was supposed to help us measure social stratification by wealth–we figured people might know if their friends had a second home, even if they didn’t know the values of their friends’ assets. But we had a problem–a lot of the positive responses seemed to be coming from people who knew immigrants who had a home back in their original countries. Interesting, but not what we were trying to measure.”
–Andrew Gelman, source:
http://andrewgelman.com/2008/03/a_funny_survey/
I should also note that in the comments on this post Paul M. Banas mentioned “being more direct” and using the phrase “vacation home” instead. This sounds like good advice to me.
Some Resources on Surveys
Here is a list of references and resources from my portion of today’s “Notes from the Field: Surveys with SwatSurvey” workshop sponsored by Information Technology Services. My presentation is specifically focused on survey question wording and order.
Many of my examples came from these general sources:
Dillman, Don A. 2007. Mail and Internet Surveys: The Tailored Design Method, 2nd Edition.
Groves et al. 2004. Survey Methodology.
Other resources:
Fowler, Floyd. 1995. Improving Survey Questions: Design and Evaluation.
American Association for Public Opinion Research (http://www.aapor.org/)
- Public Opinion Quarterly
- Survey Practice
- “AAPOR Report on Online Panels” – for a nice summary of the issues associated with opt-in web surveys.
Couper, M. P. 2008. Designing Effective Web Surveys.
Foddy, William. 1993. Constructing Questions for Interviews and Questionnaires.
Journals:
Survey Methodology
Survey Research Methods
International Journal of Market Research
Marketing Research
Journal of Official Statistics
Journals devoted to specific social science disciplines also occasionally have great pieces on survey research:
Krosnick, Jon. 1999. “Survey Research.” Annual Review of Psychology, v. 50.
Gallery of Student Engagement Items
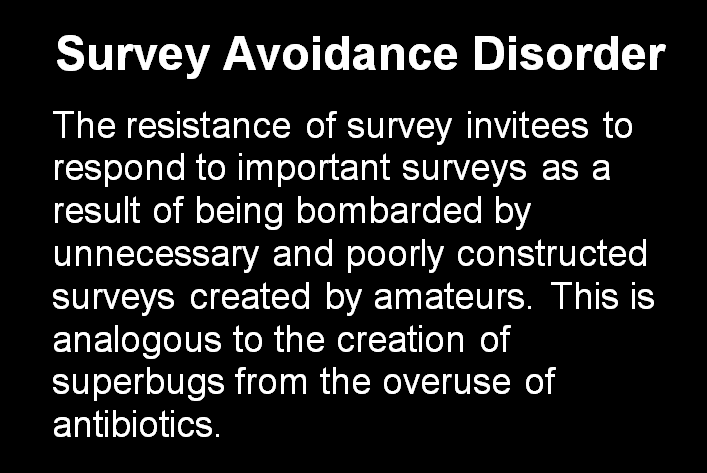
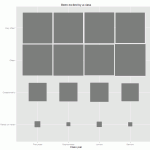
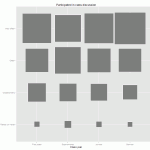
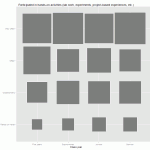
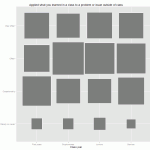
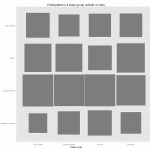
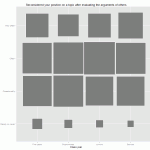
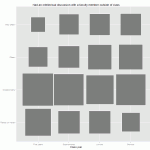
I finally had the chance to revisit an earlier post where I created a fluctuation plot for a recent survey item about the frequency of class discussion. This item is a part of an array of items that asks about the frequency (using the familiar “Rarely or never-Occasionally-Often-Very often” scale) during the academic year of a variety of activities often associated with student engagement. I created fluctuation plots for the whole set of items and put them into the photo gallery below. Like the plot from the previous post, these show the percentage of responses by category, by class year. Click anywhere on the gallery image below and you can use the arrows to flip through the items. Instructions on how to create these in R can also be found in the earlier post.
Surveys and Assessment
I’ll be talking a lot about Assessment here, but one thing I’d like to get off my chest at the outset is to state that assessment does not equal doing a survey. I’m thinking of writing a song about it. So many times when I’ve talked to faculty and staff members about determining whether they’re meeting their goals for student learning or for their administrative offices, the first thought is, “I guess we should do a survey!” I understand the inclination, it’s natural – what better way to know how well you’re reaching your audience than to ask them! But especially in the case of student learning outcomes, surveys generally only provide indirect measures, at best. In the Venn diagram:
(Sorry, I’ve been especially amused by Venn diagrams ever since I heard comedian Eddie Izzard riffing on Venn…)
Surveys are great for a lot of things, and they can provide incredibly valuable information as a piece of the assessment puzzle, but they are often overused and, unfortunately, poorly used. While it is sometimes possible for them to be carefully constructed to yield direct assessment (for example, if there are questions that provide evidence of the knowledge that was attempting to be conveyed – like a quiz), more often they are used to ask about satisfaction and self-reported learning. If your goal was for students to be satisfied with your course, that’s fine. But probably your goals had more to do with particular content areas and competencies. To learn about the extent to which students have grasped these, you’d want more objective evidence than the student’s own gut reaction. (That, too, may be useful to know, but it is not direct evidence.)
I would counsel people to use surveys minimally in assessment – and to get corroborating evidence before making changes based on survey results.
What can you do instead? Stay tuned (or for a simple preview, see our webpage on “Alternatives“)…
Survey length and response rate
We are often asked what can be done to bolster response rates to surveys. There are a lot of ways to encourage responding, but one concern that is often dismissed by those conducting surveys is the length of the survey. But people are busy, and with the many things in life demanding our attention, a long survey can be particularly burdensome if not downright disrespectful.
Below is a plot of the number of items on recent departmental surveys and their response rates. The line depicts the relationship between length of survey and responding (the regression line, for our statistically-inclined friends).
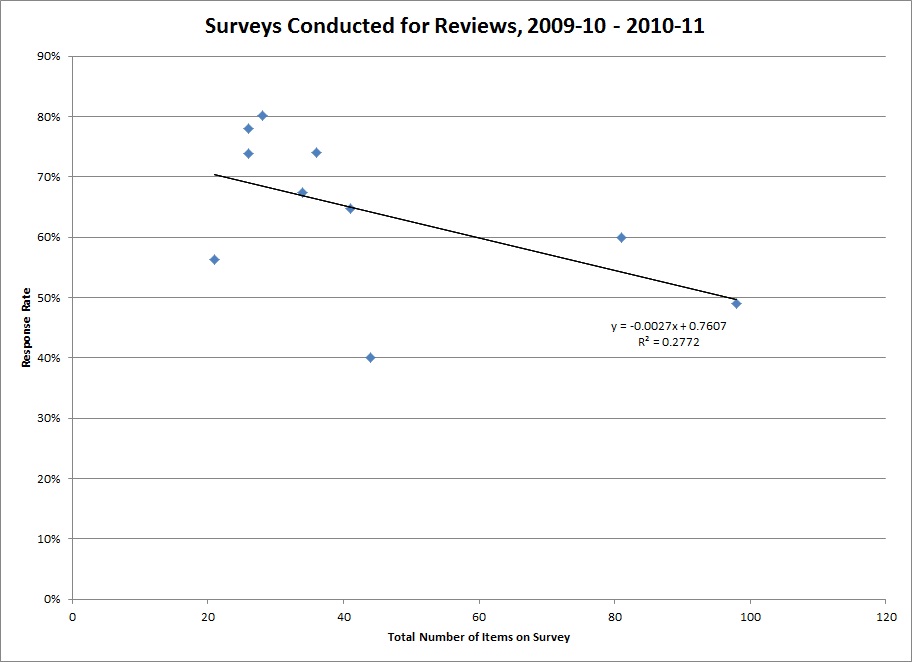 Aside from shock that someone actually asked a hundred questions, what you should notice is that as the number of items goes up, responding goes down. This is a simple relationship, determined from just a small number of surveys. Even if I remove the two longest surveys, a similar pattern holds. Of all the things that could affect responding (appearance of the survey, affiliation with the requester, perceived value, timing, types of questions, and many, many other things), that this single feature can explain a chunk of the response rate is pretty compelling!
The “feel” of length can be softened by layout – items with similar response options can be presented in a matrix format, for example. But the bottom line is that we must respect our respondents’ time, and only ask them questions that will be of real value and that we can’t learn in other ways.
Moral: Keep it as short as possible!
(For more information about conducting surveys, see the “Survey Resources” section of our website.)
