We are often asked what can be done to bolster response rates to surveys. There are a lot of ways to encourage responding, but one concern that is often dismissed by those conducting surveys is the length of the survey. But people are busy, and with the many things in life demanding our attention, a long survey can be particularly burdensome if not downright disrespectful.
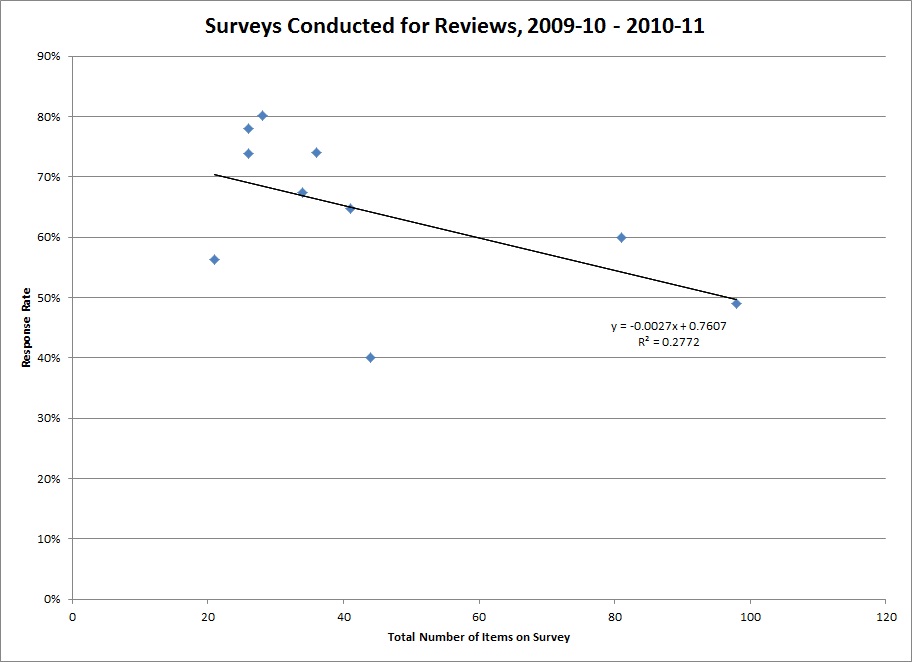
Below is a plot of the number of items on recent departmental surveys and their response rates. The line depicts the relationship between length of survey and responding (the regression line, for our statistically-inclined friends).
 Aside from shock that someone actually asked a hundred questions, what you should notice is that as the number of items goes up, responding goes down. This is a simple relationship, determined from just a small number of surveys. Even if I remove the two longest surveys, a similar pattern holds. Of all the things that could affect responding (appearance of the survey, affiliation with the requester, perceived value, timing, types of questions, and many, many other things), that this single feature can explain a chunk of the response rate is pretty compelling!
The “feel” of length can be softened by layout – items with similar response options can be presented in a matrix format, for example. But the bottom line is that we must respect our respondents’ time, and only ask them questions that will be of real value and that we can’t learn in other ways.
Moral: Keep it as short as possible!
(For more information about conducting surveys, see the “Survey Resources” section of our website.)