It’s the Number 1 time for Rankings!

Runners Crossing Finish LineA number of admissions guide publishers have released rankings recently, and the Godzilla of them all, US News, will be coming out shortly.  It’s always an interesting time for Institutional Researchers.  We spend a lot of time between about November and June each year responding to thousands (I’m not kidding) of questions from these publishers, and then in late summer and early fall we get to see what amazing tricks they perform with this information, what other sources of “information” they find to spice up their product, and the many ways they slice and dice our institutions.

The time spent on their surveys is probably the most frustrating aspect of IR work.  (Not all IR offices have this responsibility, but many do.)  We are deeply committed to providing accurate information about the institution to those who need it.  But so often guidebook questions are poorly constructed or not applicable, and the way they interpret and use the data can be bizarre.  While publishers may truly believe that they are fulfilling a mission to serve the public by providing their synthesis of what admittedly is confusing data, there is no misunderstanding that selling products (guides, magazines) is their ultimate purpose.  Meanwhile, we are painfully aware of the important work that we were not able to do on behalf of our institutions because of the time we spent responding to their surveys.

So the rankings come out, alumni ask questions, administrators debate the methodology and the merit, newspapers get something juicy to write about, and then we all go back and do it all over again.   Some of my colleagues get really worked up about this, and I can understand that.  But maybe I’m just getting too old to expend energy where it does no good.   It seems to me like complaining about the weather.  It is what it is.  You do the best you can – carry an umbrella, get out your snow shovel, hibernate – and get on with life.  Don’t get me wrong – I believe we should engage in criticism, conversation, and even collaboration if appropriate.  I just don’t think we should get ulcers over it.

<Minor Rant>That said, I do think it’s especially shameful for publishers to lead prospective students to think that “measures” such as the salaries volunteered by a tiny fraction of alumni on PayScale.com will be useful in their search for a college that’s right for them.</Minor Rant>

I think we have to acknowledge that there has been some good from all this.  There was a time when some institutions spun their numbers shamelessly (I know of one that reported the average SAT of those in the top quartile), and the increased scrutiny of rankings led to some embarrassment and some re-thinking about what is right.  It also led to a collaborative effort, the Common Data Set, in which the higher education and the publishing communities agreed on a single methodology and definitions to request and report some of the most common data that admissions guidebooks present.  In the past one guidebook would ask for average SAT, another for median, another for inter-quartile range, leave athletes out, put special admits in, and worst of all – no instructions about what was wanted.  And then people wondered why there were six different numbers floating around.  Unfortunately, once this set was agreed on and came into practice, guidebooks began to ask more and more questions to differentiate themselves from each other.  (And some still don’t use it!)  So it seems that a really good idea has backfired on us in a substantial way.

Another good to come from this is that some of the measures used by the rankings really are important, and having your institution’s data lined up against everyone else’s prompts us to ask ourselves hard questions when we aren’t where we’d like to be.  Here at Swarthmore, even though we are fortunate to have excellent retention and graduation rates, we wondered why they were a few points behind some peers.  Our efforts to understand these differences have led to some positive changes for our students.  This is likely happening at many institutions.  The evil side of that coin is when institutions make artificial changes to affect numbers rather than actually improving what they do.

On balance, I think that at this moment in time the guidebooks and rankings are doing more harm than good.  The “filler” questions that use institutional resources (do prospective students really want to know the number of microform units in the library?), and the proliferation of rankings that underscore the truly commercial foundation of this whole enterprise (Newsweek/Kaplan’s “Horniest” – really??) have gotten me a bit worn this year.

But we’ll keep responding.  And we’ll keep providing information on our website and through collaborative projects such as NAICU’s UCan (University and College Accountability Network) to try to ensure that accurate information is available.  As a parent who will soon be looking at these guides from a different perspective, I will have new incentive to see some good in it all.

So in my best live and let live spirit, I will share the Reader’s Digest description of the Big One – the US News rankings-  for my non-IR  colleagues here at Swarthmore in Part II of this post.  (IR friends, look away…)
On NOT reinventing the wheel

Stone wheelA couple of recent projects have reminded me of what a sharing profession Institutional Research is.  We often share the results of our efforts when it will help others avoid needlessly repeating that effort.  I’m not sure if it comes from the empathy that develops from working in small offices where resources are stretched so thin, or just the kind of people attracted to the field, but I have yet to meet a stingy IR person! (Although I have encountered plenty of people outside the field trying to make some money by selling us the stuff we’d otherwise “reinvent” ourselves…)

One of my earlier experiences with this kind of generosity was the data on faculty achievements collected by Carol Berthold, of the University System of Maryland.  Carol would troll press releases and websites to maintain her database by institution of faculty members’ prestigious memberships (e.g. Institute of Medicine, National Academies, etc.) and awards (e.g. NSF New Faculty Awards, Guggenheims, etc.) by institution.  And then she freely opened up her database to share with IR offices!  This was data that we all found useful in touting our faculties’ accomplishments, providing contextual peer data, etc.  Very cool!

Some of my wonderful colleagues distribute their SPSS syntax files for creating routine reports from the surveys in which a number of our institutions participate .  Inspired by this, Alex and I are trying to make an effort to share some of our SAS syntax for these same surveys.  (SPSS, SAS, and R are statistical analysis software.  Probably the majority of IR offices use SPSS, but an increasing number use SAS, with use of R starting to pick up as well.)

Collecting and summarizing publicly available peer data is another area for collaboration and sharing.  The data may be publicly available, but it can take some work to put it into a user-friendly format.  A colleague recently shared a dataset he built of Fulbright Scholars.  This effort was facilitated by staff at HEDS, and made available to HEDS members.

Having overlapping peer groups presents another opportunity to share.  My good colleague at a nearby college has given me data that I needed from a peer summary that included Swarthmore.   Another colleague at a peer institution would routinely share her fascinating anthropological/institutional research work on the CIRP survey using peer data that included Swarthmore.

Like many professional associations, ours offers “Tips and Tricks” from members through its newsletter and website.  One of the things that Alex is doing with his blog is discussing some of the technical work we do, in an effort to encourage learning about tools and shortcuts from each other.

This kind of sharing provides the gifts of convenience, insights, and time.  In the instances where we are doing or would benefit from similar projects, it just makes sense for us to spread the load.

Survey length and response rate

We are often asked what can be done to bolster response rates to surveys.   There are a lot of ways to encourage responding, but one concern that is often dismissed by those conducting surveys is the length of the survey.  But people are busy, and with the many things in life demanding our attention, a long survey can be particularly burdensome if not downright disrespectful.

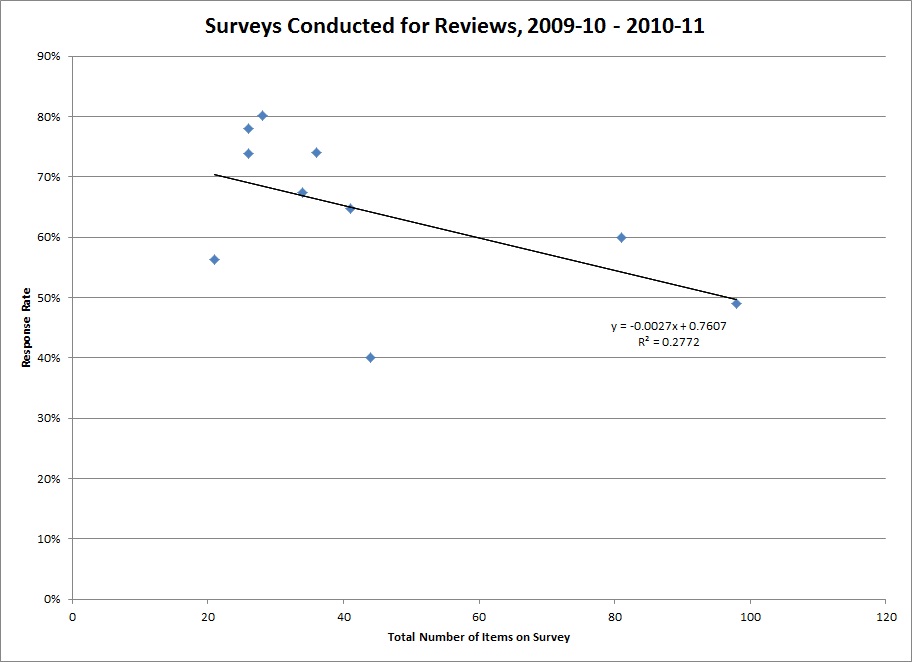
Below is a plot of the number of items on recent departmental surveys and their response rates.  The line depicts the relationship between length of survey and responding (the regression line, for our statistically-inclined friends).

Scatterplot of survey length (number of items) and percent responding shows an inverse relationship.  The longer the survey, the fewer responses.Aside from shock that someone actually asked a hundred questions, what you should notice is that as the number of items goes up, responding goes down.  This is a simple relationship, determined from just a small number of surveys.  Even if I remove the two longest surveys, a similar pattern holds.   Of all the things that could affect responding (appearance of the survey, affiliation with the requester, perceived value, timing, types of questions, and many, many other things), that this single feature can explain a  chunk of the response rate is pretty compelling!

The “feel” of length can be softened by layout – items with similar response options can be presented in a matrix format, for example.  But the bottom line is that we must respect our respondents’ time, and only ask them questions that will be of real value and that we can’t learn in other ways.

Moral:  Keep it as short as possible!

(For more information about conducting surveys, see the “Survey Resources” section of our website.)

Experiences that matter

Kitten looking in mirror sees lionWe recently heard a talk by Josipa Roksa, a coauthor (with Richard Arum) of  Academically Adrift, the  study which concluded that students aren’t learning very much in college, and which captured the attention of the higher ed community and the public earlier this year.  Hers was the keynote address at the June conference in Philadelphia of the Higher Education Data Sharing (“HEDS”) consortium, which is a group of over 100 liberal arts colleges and a few universities to which Swarthmore belongs.  We share research and planning tools and techniques.  It’s a great group of IR types, and Alex and I were lucky to have the meeting in our back yard.

At the meeting Roksa shared with our group some of the findings from the two years of research conducted since the book was completed.  Among other things, the researchers have explored experiences that positively impact student performance.  Some of the things that mattered were:  faculty having high expectations for students; more rigorous requirements for the course; time that the students spent studying alone (time spent in informal group study had a negative impact!); and department of major (some majors showed more gains than others).  One of the hopeful notes that Roksa struck at the end of her talk was that they are now having some success at identifying the good practices that improve student learning, but the key is to ensure that more students get to experience these good practices.

This got me thinking about the importance of expectations and norms (maybe my roots as a Social Psychologist are showing).   Swarthmore is a place where intense intellectual activity is just part of the ethos.  But what is interesting is that while the faculty are certainly demanding of students, students’ interest in working hard is a self-perpetuating characteristic.  They select to come here because that is the environment they see when they visit, and that’s what they want.   Once here, they do work hard, reinforcing the norm.  We’re very fortunate to have an environment where practices critical for positive learning experiences are so firmly established.   It’s easier to consider implications of studies such as this when there is a strong foundation already in place.


References

Arum, R., & Roksa, J. (2011). Academically adrift: Limited learning on college campuses. Chicago: University of Chicago Press.

HEDS is at http://www.e-heds.org/The Higher Education Data Sharing (HEDS) Consortium assists member institutions in planning, management, institutional research, decision-support, policy analysis, educational evaluation, and assessment.