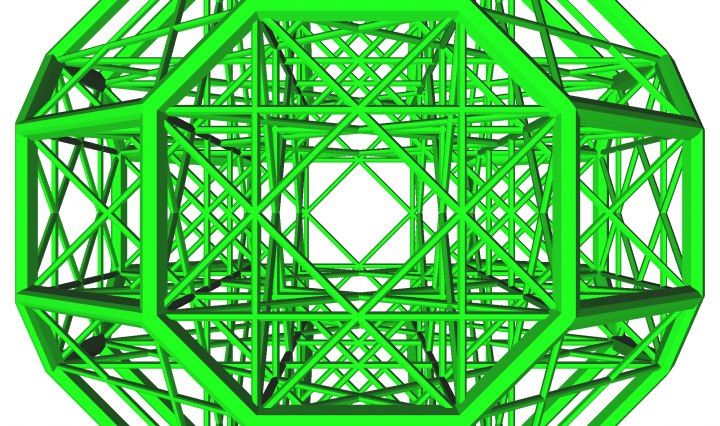
Image of algebraic reflection Weyl Group B3

SPEED Project Success: Professor Elizabeth Drellich

Each year, ITS and the Libraries sponsor Swarthmore Projects for Educational Exploration and Development (SPEED) to connect faculty projects with student workers.  Last summer, Math Professor Elizabeth Drellich and SPEED interns Kate Collins ’18 and Cassandra Stone ’20 collaborated to build reflections.swarthmore.edu, … Continue reading SPEED Project Success: Professor Elizabeth Drellich

SPEED Project Wrap Up for Summer 2017

At the end of July, ITS and Library staff and student workers completed another set of Swarthmore Projects for Educational Exploration and Development (SPEED). David Molina Cavazos ’20 worked with Assistant Dean Liz Derickson and Associate Director of Client Services Erin Massey, to create firststeps.swarthmore.edu, a site that Swarthmore students and faculty advisors can use to explore majors.  Each page contains data collected from alumni to provide guidance on what students do after graduation, sample career paths, and student narratives.  The Dean’s Office is using First Steps to assist with course advising this year. Kate Collins ’18  collaborated with Math Professor Elizabeth Drellich to … Continue reading SPEED Project Wrap Up for Summer 2017

SPEED Projects for Summer 2017 Announced

ITS and the Libraries are pleased to announce the SPEED Project awardees for the Summer of 2017. Each Spring, the Swarthmore College Libraries and ITS invite all current employees to submit proposals to Swarthmore Projects for Educational Exploration and Development (SPEED). SPEED awards provide dedicated support from software developers, librarians, academic technologists, and student interns for an eight-week period of project development.  With a SPEED project team’s help, faculty and staff can create a new digital object or resource that enhances teaching or facilitates undergraduate research. For Summer 2017, the projects will focus on Data Visualizations.  From infographics to interactive … Continue reading SPEED Projects for Summer 2017 Announced

Data Visualization and Projection

Data visualization involves the presentation of data in a pictorial or graphical format that engages the viewer with information. These visualizations can then be printed, displayed, or projected into spaces to make difficult concepts easier to grasp, reveal patterns that would otherwise be opaque, or provide alternative interpretations of information. They can be used artistically, theatrically or informationally and can change the way people inhabit space. Interactive visualizations may respond to user inputs, or live data feeds and take the concept a step further by allowing you to drill down into charts and graphs for more detail, changing what data … Continue reading Data Visualization and Projection