Create with SPEED logo

2019 Student SPEED Summer Internship applications open now!

This summer, ITS and The Libraries are looking for students from across disciplines for an eight-week opportunity developing and learning new technologies while contributing to faculty and staff digital projects within what we call Swarthmore Projects for Educational Exploration and … Continue reading 2019 Student SPEED Summer Internship applications open now!


Makerspace Made Grad School Possible: Interview with Tracy Tang

  The Beardsley MakerSpace is a welcome resource for students, faculty and staff who are eager to create and realize their ideas physically. MakerSpace Manager Russell Prigodich and the Academic Techology team are ready to help you realize your ideas in … Continue reading Makerspace Made Grad School Possible: Interview with Tracy Tang

SPEED Projects for Summer 2017 Announced

ITS and the Libraries are pleased to announce the SPEED Project awardees for the Summer of 2017. Each Spring, the Swarthmore College Libraries and ITS invite all current employees to submit proposals to Swarthmore Projects for Educational Exploration and Development (SPEED). SPEED awards provide dedicated support from software developers, librarians, academic technologists, and student interns for an eight-week period of project development.  With a SPEED project team’s help, faculty and staff can create a new digital object or resource that enhances teaching or facilitates undergraduate research. For Summer 2017, the projects will focus on Data Visualizations.  From infographics to interactive … Continue reading SPEED Projects for Summer 2017 Announced

Data Visualization and Projection

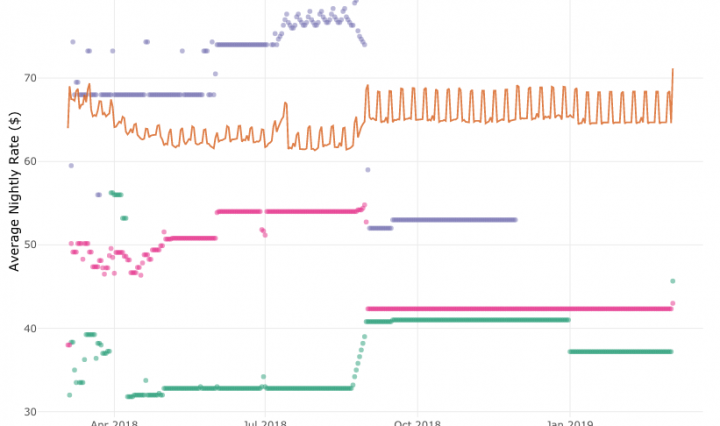
Data visualization involves the presentation of data in a pictorial or graphical format that engages the viewer with information. These visualizations can then be printed, displayed, or projected into spaces to make difficult concepts easier to grasp, reveal patterns that would otherwise be opaque, or provide alternative interpretations of information. They can be used artistically, theatrically or informationally and can change the way people inhabit space. Interactive visualizations may respond to user inputs, or live data feeds and take the concept a step further by allowing you to drill down into charts and graphs for more detail, changing what data … Continue reading Data Visualization and Projection