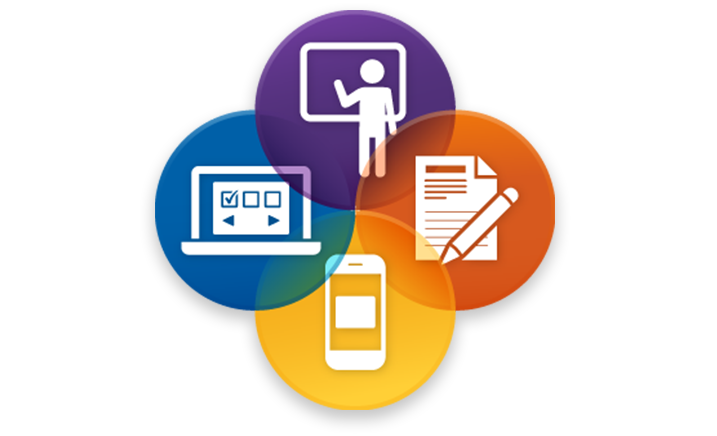
Right before Thanksgiving break, we wrapped up our 3 part blended learning workshop series where we explored different ways in which faculty at Swarthmore could incorporate blended learning in their coursework. For those unfamiliar, blended learning is a mix of online, self-paced learning and face-to-face classroom instruction. It’s also something that many faculty are already doing in their teaching. It’s important to discuss because studies have shown reports of improved student outcomes such as:
- higher rates of student-to-student and student-to-instructor interaction (Aycock, Garnham, & Kaleta, 2002)
- Earn higher scores on exams (Garnham & Kaleta, 2002; O’Toole & Absalom, 2003)
- Demonstrate a better understanding and deeper exploration of concepts (Bauer, 2001; Cameron, 2003)
The 3 workshops covered the fundamentals of blended learning, using mobile apps for blended learning, and how to utilize active learning classrooms for blended learning. Overall, the workshops went really well and they presented a great opportunity for faculty to hear and learn from each other.
Design With the End In Mind
One of the main points we talked about was the idea of building a blended learning exercise with the end in mind, first. It is important to identify what you want students to be able to do and then incorporate that into your learning objective. This will help determine which digital tool is best for content delivery, course activities, and assessment.
Blended Learning in 4 Steps
We learned about 4 steps that can be used while developing a blended learning exercise:
- Learning objectives
Design with the end in mind. Think about what do you want students to do and incorporate that action into your learning objective. - Content Delivery
Determine what tool is best for delivery that will help students achieve the objective. - Activities
Create activities that will enable students to achieve the objective and allow you to observe whether the lesson is syncing in. - Assessment
Provide an assessment activity that will allow for evidence that the learning objective was achieved.
Digital Tools That Can be Used for Blended Learning
We also learned about several digital tools to consider while developing a blended learning exercise that would be great for your content delivery, course activities, and assessment. Below you can find a brief overview of some tools we discussed. You can also take a look at this Google Doc to read about even more digital tools we touched on.
Panopto is our video streaming and lecture capture system that makes it easy to stream, record, and share videos. Panopto can capture your screen, audio, and/or video from webcams to record live lectures, student or guest presentations, demonstrations, and/or supplemental materials. You can also upload any previously created video to Panopto to be shared via link or embedded into any web page, including Moodle.
All Swarthmore faculty, staff, and students have a basic Zoom account for video web-conferencing. A Basic account is limited to 40 minutes per call. To hold a meeting longer than 40 minutes, you need a Pro account. Simply contact Media Sevices and they will provide you with a Pro Account with unlimited minutes. Sign in with your Swarthmore College username and password. You can use Zoom to have an audio or video chat with anybody else and you can invite up 49 other people into a meeting for a total of 50 people on one call.
Piktochart is a browser-based infographic and poster building tool. You can create simple and clean infographics by hand, or import spreadsheet data for more calculation-intensive data visualizations.
StoryMap JS (confusingly similar in name to ArcGIS Story Maps) is an easy-to-use mapping platform. StoryMap’s biggest strength is narrative-driven maps, in which a story is told with temporal and spatial context. You can guide a user through a mapped narrative, or they can explore on their own. By copying and filling in the provided Google Spreadsheet template, you can create a StoryMap without any need for front-end web development skills.
Explain Everything makes it easy to record screencasts. This is useful for creating 5-10 minute explanations or mini-lectures. Also great for annotating Pdfs and images. Explain Everything records pen strokes and a voiceover, which can be exported as a video.
Anyone can use Quizlet to study and learn content created by other users or to create your own custom study sets and digital flashcards. Study sets can be shared with your students.
Want To Learn More?
Take a look at our ITS Help Documentation pages to learn how to use some of these tools. And of course, feel free to reach out to acadtech@swarthmore.edu if you have any questions on how to get started!

