While most students were off exploring the world, or doing research in labs local and remote, a small, dedicated group of five students (Guin Mesh, Kyle Vu, Rebecca Regan, Richmond Mensah and Tai Warner) stayed at Swarthmore to work on Special Projects for Educational E-Development with the Libraries and Information Technology Services. This summer, the projects included creating a front end for and collecting data about our buildings, the energy, water and resources they use, a project to create a real-time, automated transcription of classroom presentations into editable text that could become the close-captioning for video recordings of those presentations, a graphical visualization of the entirety of the Libraries holdings as divided up by call number, and thereby topic of each work, and a coherent new presentation for the Libraries collection of Civil Rights Oral Histories using Omeka. All of these projects will contribute to making Swarthmore a more interesting, informative and productive place for all of our community.
 The Oral Histories have been in the Collection now for a while and really needed a tool to allow students and researchers to better access the content. Valuing both a respectful look and feel, while maintaining the accessibility of the site challenged the students, who worked collaboratively to delve into everything from the fonts in use to the backgrounds, to the consistency of presentation of the material, while keeping it all looking good for future viewers. This is valuable material that needed a venue for it’s presentation that reflected the importance of the content. We’re looking forward to when the full collection of this material can be released through this effort.
Supporting students who might want or need to access the transcript of what their professor says can be a crucial step towards our efforts to make Swarthmore a more welcoming place both for those with disabilities as well as those who might learn more effectively from reviewing a class content transcript. If we can automate the process of creating such transcripts, it takes a huge burden from faculty presenters, while at the same time allowing everyone to potentially grasp material more completely, or even reflect more fully about the content of a presentation. While not complete yet, this project made significant strides towards a functional approach, leveraging the online transcription services of Microsoft, after feeding the system a diet of content specific to the disciplines taught here as a basis for the transcription. In undertaking this effort, Swarthmore joins a small set of leading institutions at the forefront of automating accessibility for the benefit of everyone.
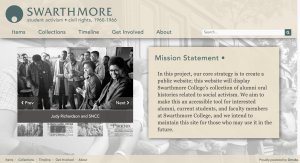
While our Libraries holdings are impressive, it’s not always possible to get a grasp of the breadth and a sense of those holdings, or of the areas in which we have more specific coverage in depth.The SPEED students took up the challenge of this project’s goals with eagerness, and a truly collaborative approach. This is something that every library patron and librarian here at Swarthmore struggles to understand fully, as they get to know the collection more completely. To our great pleasure, the SPEED students not only collaboratively developed a coherent way to represent the data about the collection, they did so while also providing an accessible version for the visually impaired, who wouldn’t be able to appreciate the graphical version. The table that adjoins the graphical presentation also lets the data be easily downloaded for others to do analysis on the collection!
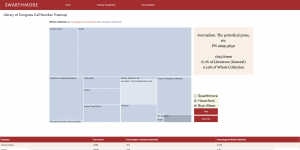
The fourth project our intrepid SPEED students tackled is the presentation of environmental data on the various buildings here at Swarthmore. Newer control systems allow building data, such as energy use, water use, hot water, etc. to be queried in real time. But we needed a site to make that data available and to present it in a way that made sense. This project integrated work with the Sustainability Office, the Facilities Department, and Information Technology Services to provide interested campus community members with real-time data on the energy and systems used by the buildings they live and work within. Once the back end is completed, it will also allow us to better document changes that our community makes to become more sustainable with our energy and water use as it impacts the consumption of those resources through each building, while at the same time, providing a tremendously useful teaching tool for evaluating different buildings of different construction eras through the wide ranging environmental conditions of each season.
All together these project tackle a range of data visualization and informational areas that really serve our community with much needed and appreciated insights into how things work here at Swarthmore College. We have been extremely impressed with the efforts, skill development and above all, collaborative spirit and approach in the success these five students have accomplished this summer.