I had the opportunity recently to attend a Section 508 Best Practices Webinar: Maps for All – Building Accesible Maps, hosted by the Great Lakes ADA Center. The two presenters, Kelley Bailey the Section 508 Application Testing Team Lead of the FAA and Amy Ellison of the Minnesota Department of Natural Resources presented examples of the ways in which their agencies have been working to develop better online map applications to accommodate folks with accessibility needs. Maps are fundamentally a visual medium, yet at a gross scale can be tactile as well. But there are lots of levels of need in the accessibility space too; it’s not all or nothing. So to start with, it’s important to think through the core of what any map you produce is intended to communicate. Once you understand that, you can take steps to eliminate confusing elements, and to provide alternate methods for presenting data to folks with different needs.
One really impressive example was an online map tool that’s in development by the FAA that starts the cursor on an accessibility button. The web map is fully navigable via keyboard, but with a couple of selections in a pop-up accessed through that button, the user could select wether to present the data as a visual map, or as a data table. The user could also separately select whether to present explanatory text along with each of the data entry fields in the application. Those field descriptions could be presented by a screen reading application to assist the user.
There were a number of areas in which standard web maps can generally be improved. For visually impaired users, being careful about colors and using colors that are not easily conflated by those with color blindness or color anomalous conditions can be incredibly important. Similarly, making sure that there are not drop-shadows, and confusing overlapping lines and textures helps with map clarity. For those with low vision that need to dramatically scale an image, making sure that text doesn’t auto resize down as the scale changes can make the content more readable.
It was recognized that some maps, such as many of those used by the FAA have required standardizations (sometimes international aviation standards) that can make them harder for visually impaired folks to use. And there are online mapping tools, like ESRI’s StoryMaps that are not fully accessible yet either. While it was recognized that this effort to make maps more accessible is a work in progress, it was heartening to learn that despite the current state of things, companies like ESRI, maker of the ArcGIS suite of mapping tools, is making significant steps with their latest versions and has made commitments to improving the accessibility of their mapping products, including the popular StoryMaps application as they push further into web mapping.
There are tools out there for checking web sites, and there are more resources, such as https://mn.gov/map-accessibility which details some more specific guidelines for online maps. Here’s a color contrast checker: https://tpgi.com/color-contrast-checker/ and https://colororacle.org/ is useful for checking colors as well. The web accessibility evaluation tool (WAVE) browser extension from https://webaim.org can help folks to check their web site for accessibility, including web maps. Other good sites include the accessibility and section 508 compliance too available from the SSA: https://www.ssa.gov/accessibility/andi/help/install.html and the resources available through https://www.nvaccess.org/.
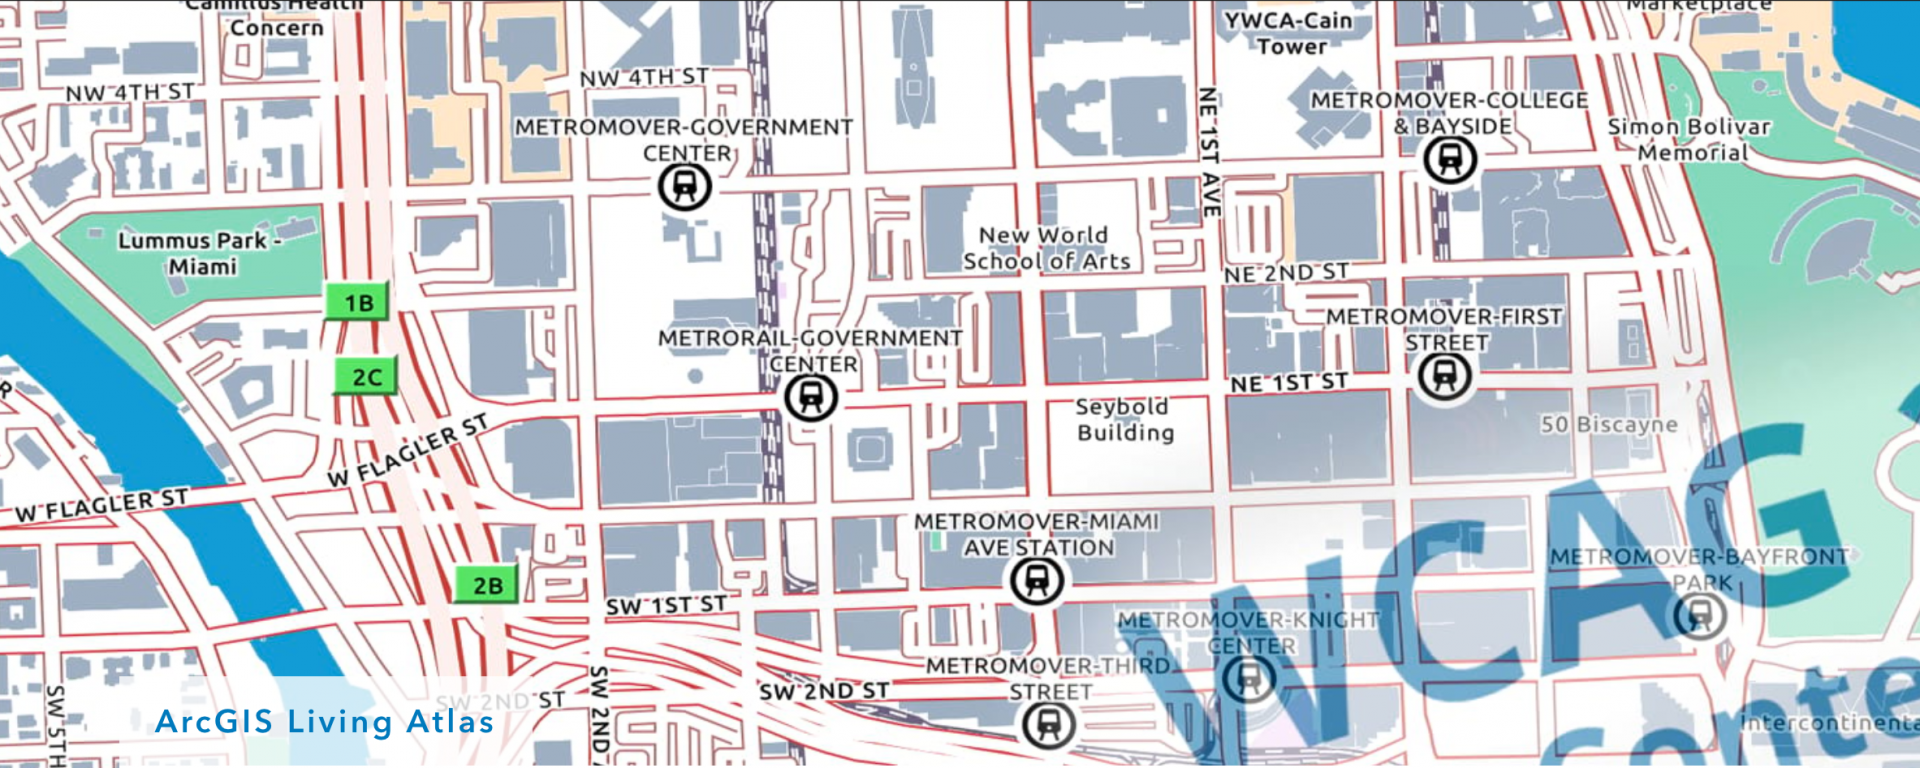
(Header image credit: Map header from Andy Skinner’s 2020 Blog Post on Accessible Basemaps- https://www.esri.com/arcgis-blog/products/arcgis-living-atlas/mapping/towards-an-accessible-basemap/)