
Header image attributed to https://www.pexels.com/photo/close-up-view-of-a-golden-coin-315788/ 😃
As I was glued to the Bitcoin charts on my phone late-night this Sunday, trying to time the dip, I thought to myself — It would be super nice to have something that could display and analyze historical Bitcoin prices, and perform actions on my behalf when certain price events happen.
So I began to brainstorm for a bit and put together a rough plan to do just that. Here is what I came up with.
- Create a web app using ReactJS to display the price data, as well as allow the user to interact with it.
- Run the app on a Raspberry pi / Arduino (with a display).
- Use webhooks to trigger functions once certain price events happen.
This post will go over building the react app.
Project Setup
Ok, so step 1 of the project will be to get our react project set up, along with the dependencies. I’m going to use create react app to bootstrap a react project, clean up the bloat from it (this is an optional step, but it’s always a good idea to practice good housekeeping 🧹), then install my other dependencies. I’ve decided to use the Victory chart library for this project.
Anyways, you can use the following commands to get the project set up.
npx create react-app crypto-react-charts
cd crypto-react-charts
npm i victory
npm start
Awesome, so we now have a react project set up and running on a development server. The next step is to add the price data to the main App component.
Getting the Price Data
For price data, we are going to use the Coindesk API, specifically, the close.json endpoint. There’s no authorization required to use this API, but there’s a stipulation that you must include a link back to the CoinDesk price chart in your app.
In App.js, we need to do the following:
- Create a function to fetch the price data.
- Convert it to a format that our Victory chart can use.
- Fetch the data once the App component mounts
We will also create 2 date pickers so that the user can further filter the price data. The following code takes care of all of that (we will create the Chart component in the next section).
import {useState, useEffect} from 'react';
import Chart from './Chart';

import './App.css';

function App() {

  // The price data received from the API.
  const [bpi, setBpi] = useState(null);
  // Any errors we may receive.
  const [error, setError] = useState(null);
  // The start date filter.
  const [startDate, setStartDate] = useState('');
  // The end date filter.
  const [endDate, setEndDate] = useState('');

  // Get the data from the Coinbase API
  const fetchData = async (start=null, end=null) => {
    const url = new URL(
      'https://api.coindesk.com/v1/bpi/historical/close.json
    ');
    // Assign the start date if it exists.
    start && url.searchParams.set('start', start);
    // Assign the end date if it exists.
    end && url.searchParams.set('end', end);
    // Make the request.
    const response = await fetch(url.toString());
    const data = await response.json();
    return data;
  }

  // When the component mounts, or when startDate or endDate
  // change, fetch the data.
  useEffect(() => {
    fetchData(startDate, endDate)
      .then(data => {
        // Format the data to use with VictoryLine chart.
        const bpi = Object.keys(data.bpi).map(key => ({
          x: key,
          y: data.bpi[key]
        }));
        setBpi(bpi);
      })
      .catch(error => setError(error))
  }, [startDate, endDate]);

  return (
    <div className="App">
      <main>
        <h6>BTC Price History</h6>
        {bpi && <Chart data={bpi} />}

        <div className="date-inputs">
          <label>
            Start: <input
              value={startDate}
              onChange={e => setStartDate(e.target.value)}
              type="date"
              min="2021-10-15" />
          </label>

          <label>
            End: <input
              value={endDate}
              onChange={e => setEndDate(e.target.value)}
              type="date"
              max="2021-11-15" />
          </label>
        </div>
      </main>

      <footer>
        <a href={"https://old.coindesk.com/price/bitcoin"}>
          Powered by Coindesk
        </a>
      </footer>
    </div>
  );
}

export default App;
Creating the Chart
The last piece of the project is to create our chart component. We will be using a VictoryLine chart to plot the price points received from the API.
Create a new file, Chart.js, and add the VictoryChart components (please see the Victory docs for further reference). Your Chart.js should look similar to this. (Notice that we had to do some formatting for both of the axis labels).
import {VictoryChart, VictoryAxis, VictoryLine} from 'victory';

export default function Chart(props) {
    return (
        <VictoryChart
            width={640}
            height={440}
        >
            <VictoryLine
                data={props.data}
                interpolation="natural"
                domain={{y: [58000, 68000]}}
            />

            <VictoryAxis
                fixLabelOverlap={true}
                tickFormat={t => new Date(t).toLocaleDateString()}
                style={{ tickLabels: {fontSize: 10} }}
            />
            <VictoryAxis
                dependentAxis
                style={{ tickLabels: {fontSize: 10} }}
            />
        </VictoryChart>
    );
}
You should end up with the following:
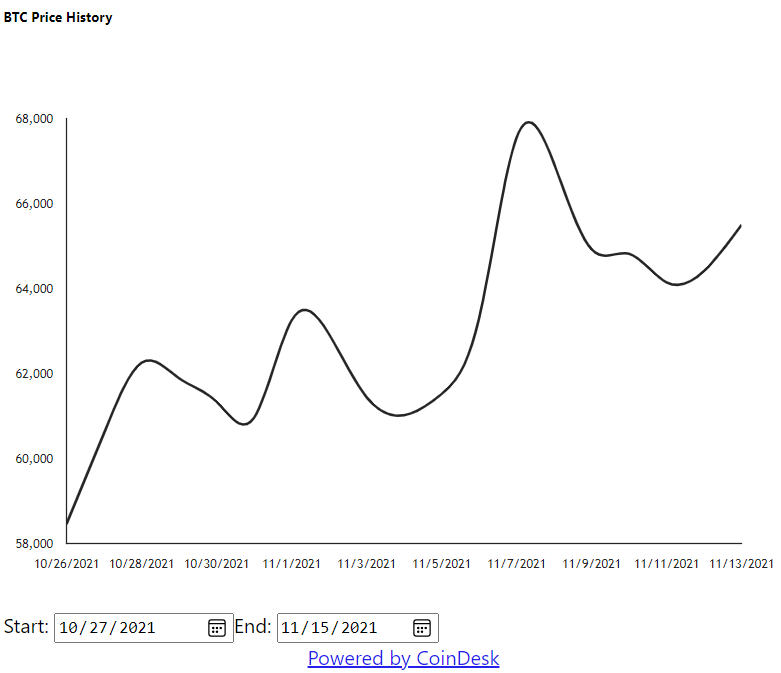
Conclusion
That’s pretty much it! There are a lot of ways you can extend this code (getting prices for different coins, fetching real-time data, dynamically setting the axis domain based on price data, adding email/SMS alerts, etc.), some of which will be covered in future posts, so stay tuned!
You can find the full codebase for this project here and the deployment of it here.