Learning Together
On June 6th & 7th group of ten faculty, five staff and five student research assistants all participated together in a two-day workshop on “R.” R is an open source integrated suite of software facilities for data manipulation, calculation and graphical display that is fast becoming the data analysis toolkit of choice across a number of disciplines, and has become the foundational data analysis software taught here at Swarthmore in introductory statistics classes. We had a lot of fun in a collegial environment in which Visiting Assistant Professor Lu Chen took us in a very organized way through the basics of the R environment using both the desktop and online versions of R Studio, which is an excellent but not necessary way to work with R.
 R Studio
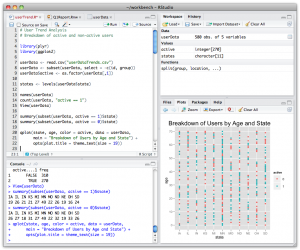
RStudio provides a graphical interface, with a very flexible windowing system to manage your work in R, preserve code, data files and output. You can use R simply at the command line, and many of our most experienced R users will take that approach. Since Swarthmore has a license for R Studio Server, run on an Amazon Web Services instance, it’s a great way to make sure your students are all on the same version and have access to the same tools for teaching data analysis using R, and it’s a very consistent interface with the desktop version, which can be installed locally on your machine. Using the R Studio Server allows you to provide students with both a consistent version as well as the ability to provide them all with the same files and data sources. (http://rstudio.swarthmore.edu is the address, but please talk to one of your friendly Academic Technologists to get set up with an account, if you’d like to check it out!)
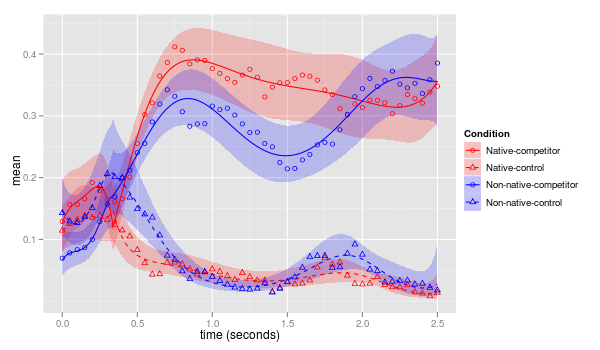
On the second day of the workshop, we really got into more advanced data recoding, dealing with missing values and using the ggplot package to create very good looking graphic displays of information, which is a real strength in R, and is something that has brought over a significant number of folks who might not otherwise have been interested.

DataCamp
We’re also pleased to announce that we’ve acquired a number of seats for DataCamp (http://www.datacamp.com), which is an online learning platform for folks who’d like to get better with Data Science and Analysis using R and Python. The DataCamp material is primarily for R and Python development, and their courses are presented in a very coherent, clean, easily accessible environment that can help individuals develop their skills from the comfort of their own browser! Please contact Doug Willen (willen@swarthmore.edu, x-7787) for more information on DataCamp, or to get started with a course.
What is “R” ?
![]() (From the R Foundation https://www.r-project.org/about.html):
(From the R Foundation https://www.r-project.org/about.html):
R is an integrated suite of software facilities for data manipulation, calculation and graphical display. It includes:
- an effective data handling and storage facility,
- a suite of operators for calculations on arrays, in particular matrices,
- a large, coherent, integrated collection of intermediate tools for data analysis,
- graphical facilities for data analysis and display either on-screen or on hardcopy, and
- a well-developed, simple and effective programming language which includes conditionals, loops, user-defined recursive functions and input and output facilities.
R is a language and environment for statistical computing and graphics. It is a GNU project which is similar to the S language and environment which was developed at Bell Laboratories (formerly AT&T, now Lucent Technologies) by John Chambers and colleagues. R can be considered as a different implementation of S. There are some important differences, but much code written for S runs unaltered under R.
R provides a wide variety of statistical (linear and nonlinear modelling, classical statistical tests, time-series analysis, classification, clustering, …) and graphical techniques, and is highly extensible. The S language is often the vehicle of choice for research in statistical methodology, and R provides an Open Source route to participation in that activity.
One of R’s strengths is the ease with which well-designed publication-quality plots can be produced, including mathematical symbols and formulae where needed. Great care has been taken over the defaults for the minor design choices in graphics, but the user retains full control.
R is available as Free Software under the terms of the Free Software Foundation’s GNU General Public License in source code form. It compiles and runs on a wide variety of UNIX platforms and similar systems (including FreeBSD and Linux), Windows and MacOS.