Recently, we have been exploring an exciting new tool for course web projects called Scalar. Scalar works much like the popular blogging tool and publishing platform WordPress; you create pages of content through a text editor, then publish, and present those to your readers. Scalar expands on this by allowing the reader to traverse collections of information through a multitude of non-liner ways. Rather than limit readers by presenting sections on a particular subject that require them to begin at the beginning and end at the end, you have the ability to create detours or “paths” that provide connections between various themes, subjects, or media, thus expanding the connections of your project and the content within.

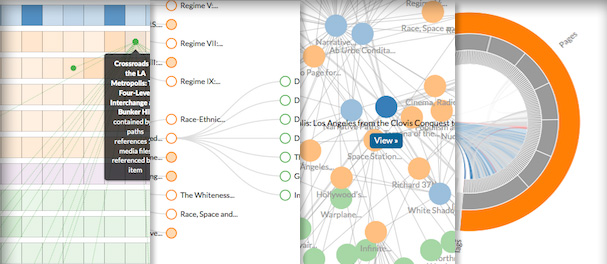
Scalar presents these connections through a series of visual displays which can be set as the default view for individual pages.
This platform is also highly customizable; the javascript API provides the ability to hook into the data associated with your pages and media and serve them up with creative presentations. These can be developed in-house or with highly sophisticated visualization libraries like d3.js.
The Scalar API:
http://scalar.usc.edu/works/guide/working-with-the-api?path=advanced-topics
The following are examples of Scalar web projects:
- The Knotted Line – a custom front end supported by a Scalar back-end: http://scalar.usc.edu/anvc/the-knotted-line/index
- The Knotted Line – a video explanation of the project’s development process: http://player.vimeo.com/video/50184018
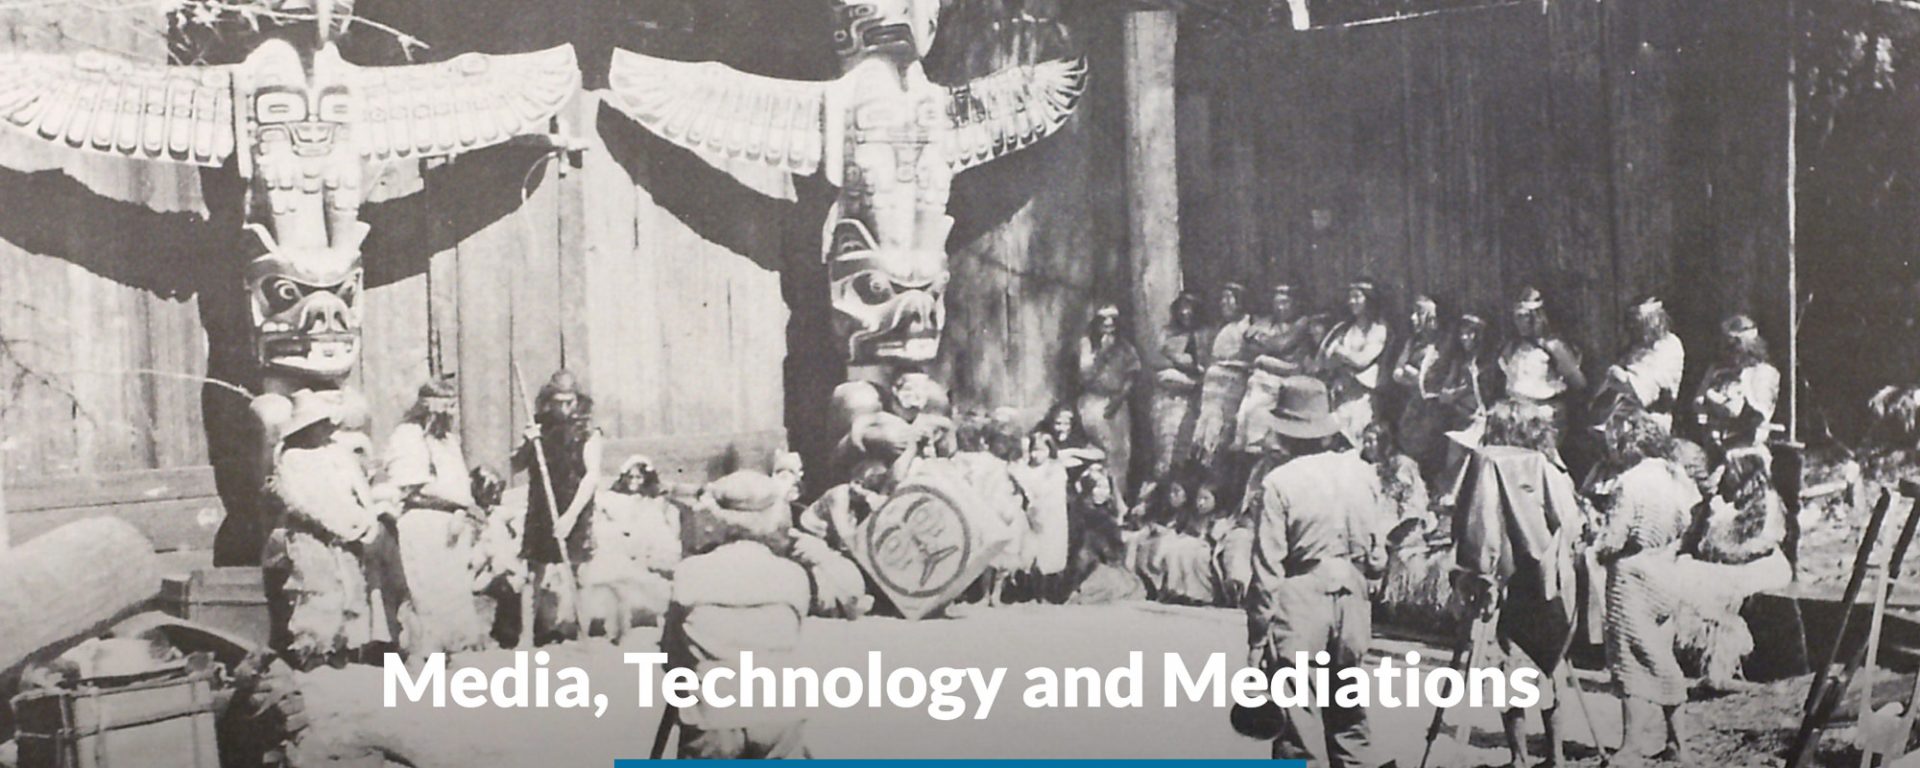
- Performing Archive: Curtis and the “Vanishing Race:” http://scalar.usc.edu/works/performingarchive/index
- We Are All Children of Algeria: http://scalar.usc.edu/nehvectors/mirzoeff/index

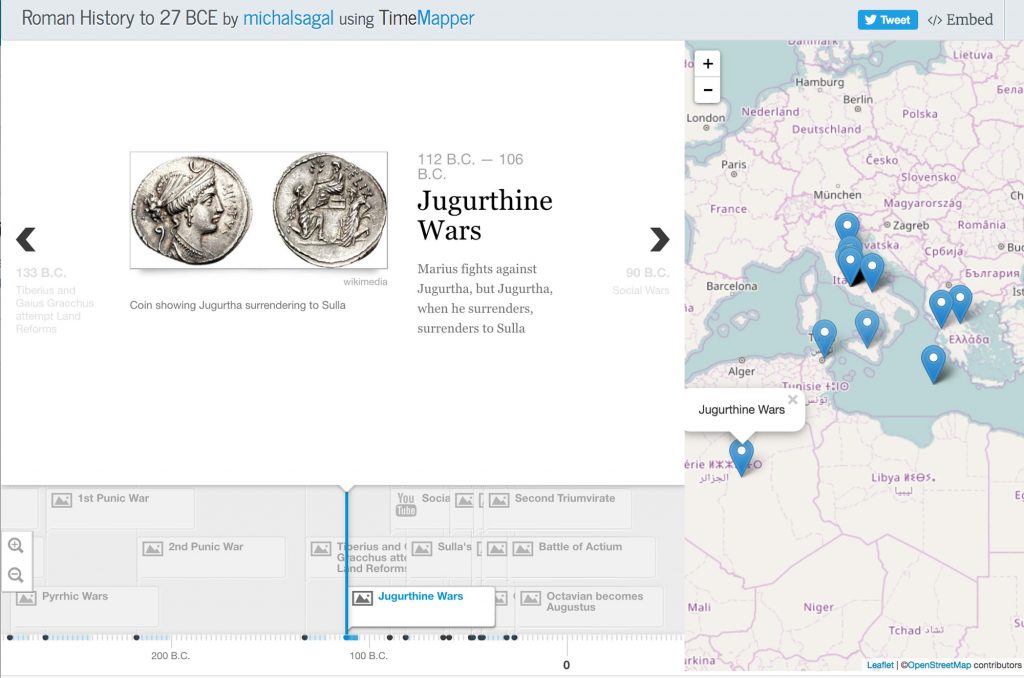
http://timemapper.okfnlabs.org/michalsagal/roman-history-to-27-bce#11
Scalar allows the user to embed third party apps for a variety of timeline and geo-mapping visualizations:
http://scalar.usc.edu/works/guide/how-to-embed
If you are interested in using Scalar, we’d suggest exploring and reading through the Getting Started guide. This will not only provide a great introduction, but also a solid example of how information is presented, organized, and paths are created in Scalar. The approach Scalar takes may lend itself to some visual thinking exercises as you develop content and think about how to present your materials. Finally, we encourage you to come talk to the Academic Technology team about any ideas you may have.


