Overall Experience Items by Subgroup
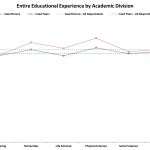
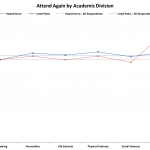
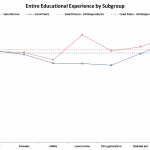
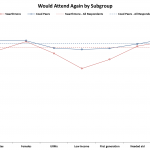
The following charts show the results of two of the measures of students’ overall satisfaction with their experience at Swarthmore from the survey (“How would you evaluate your entire educational experience at Swarthmore College?” and “If you could start all over again, would you attend Swarthmore College?”). These results are broken into various subgroups.
The first set of charts show these items broken down by academic division. The next set of charts shows these items broken down by other subgroups of interest, like under-represented minority (URM), athlete, and low income (family income of $25k or less from the survey).
Click on the thumbnails to see the gallery of full size charts.
NOTES
This is a follow-up on the whitepaper found here:
To see the 2011 Enrolled Student Survey instrument click here.