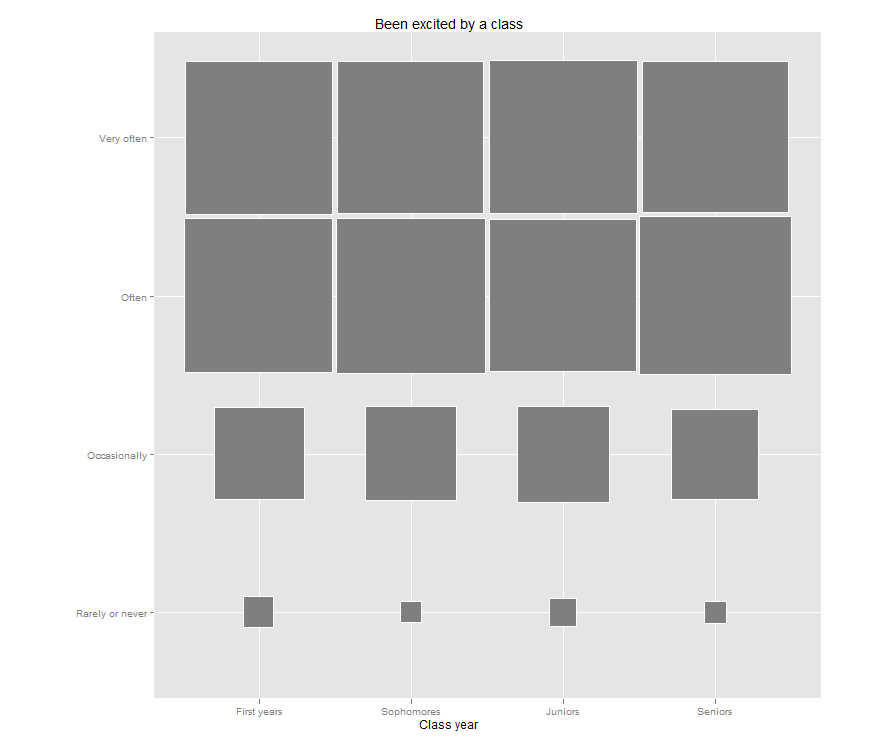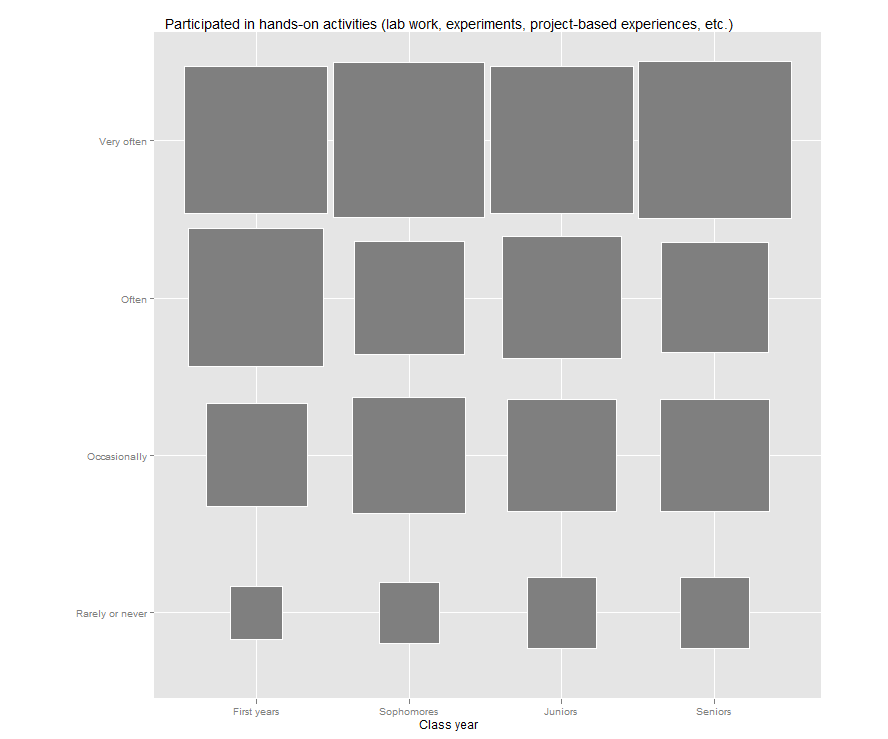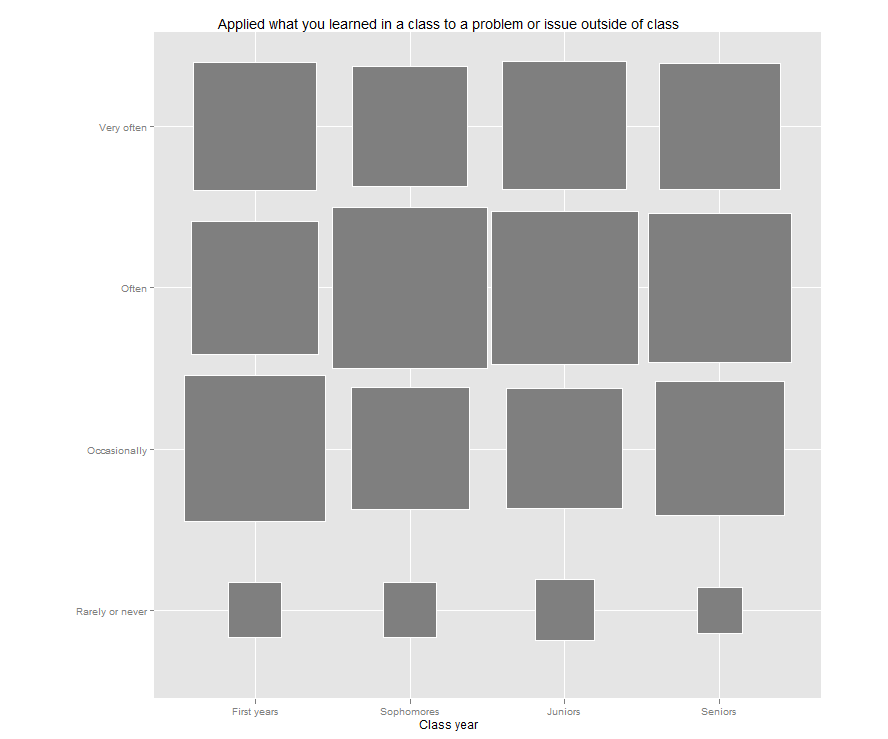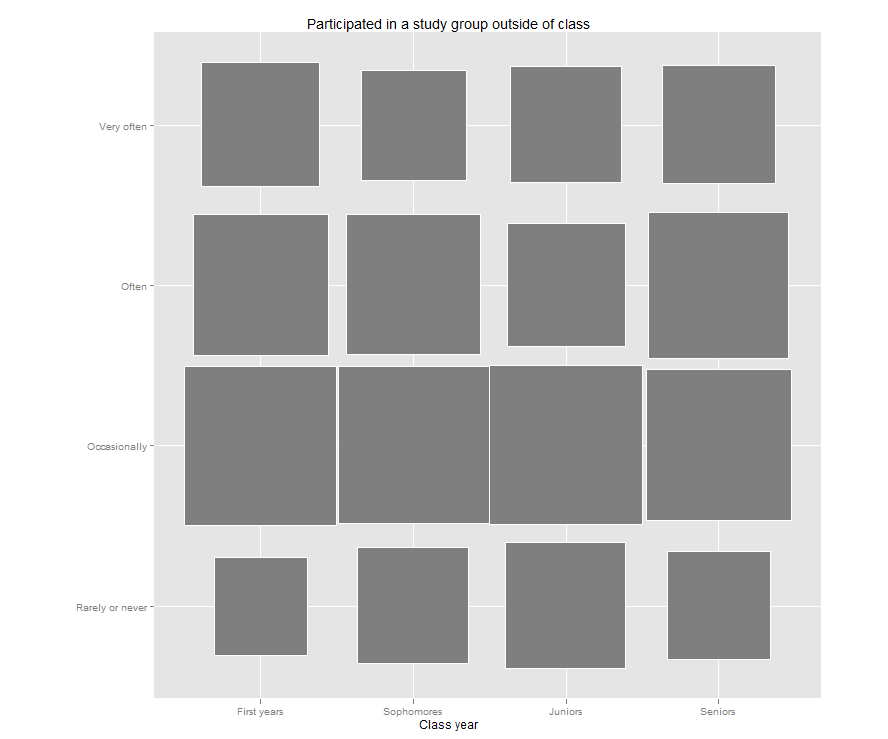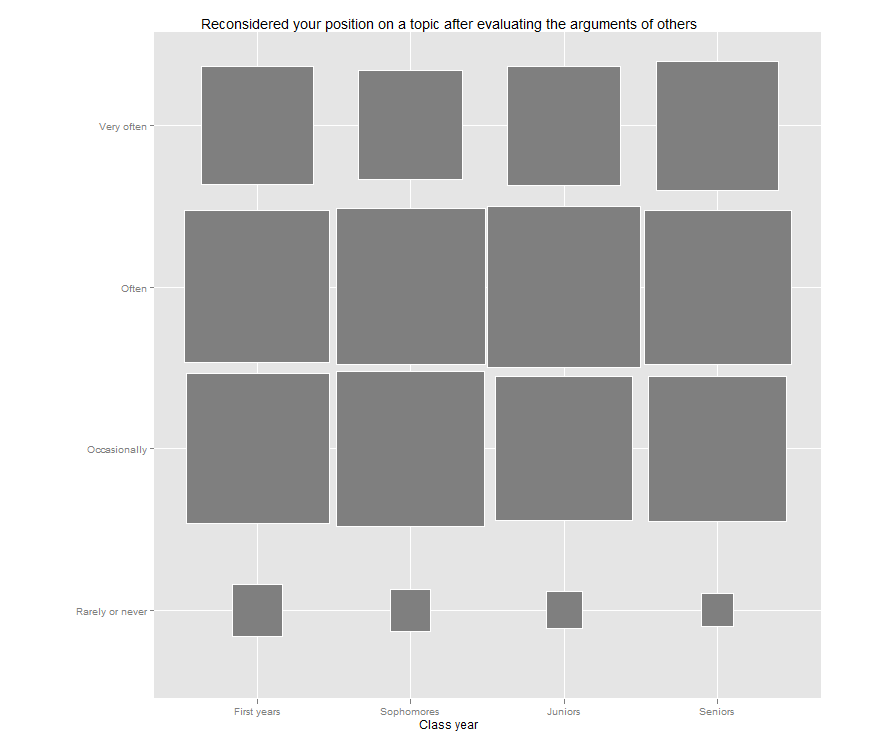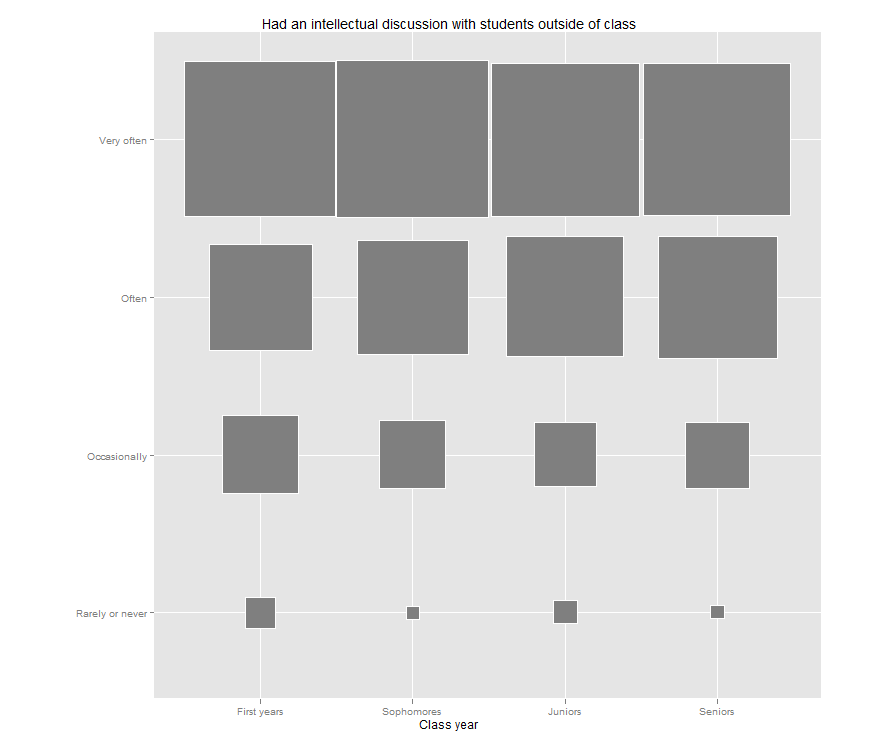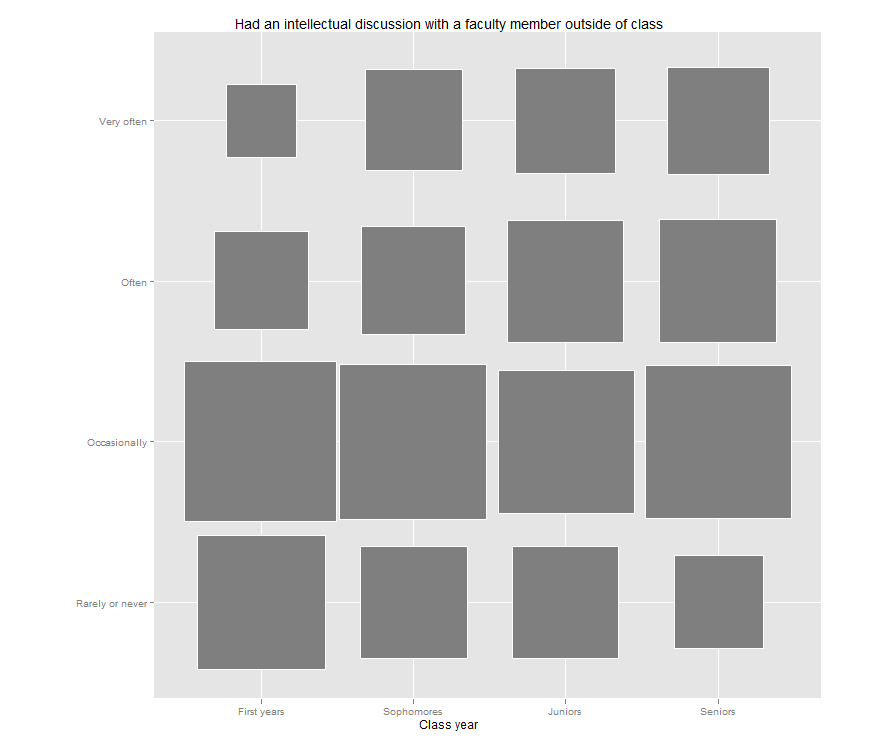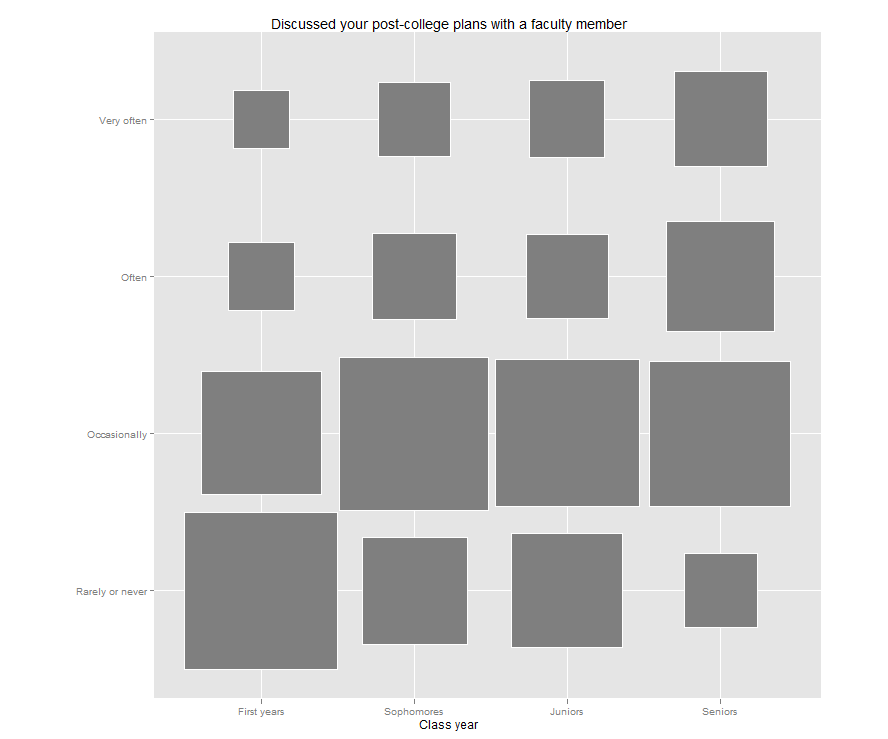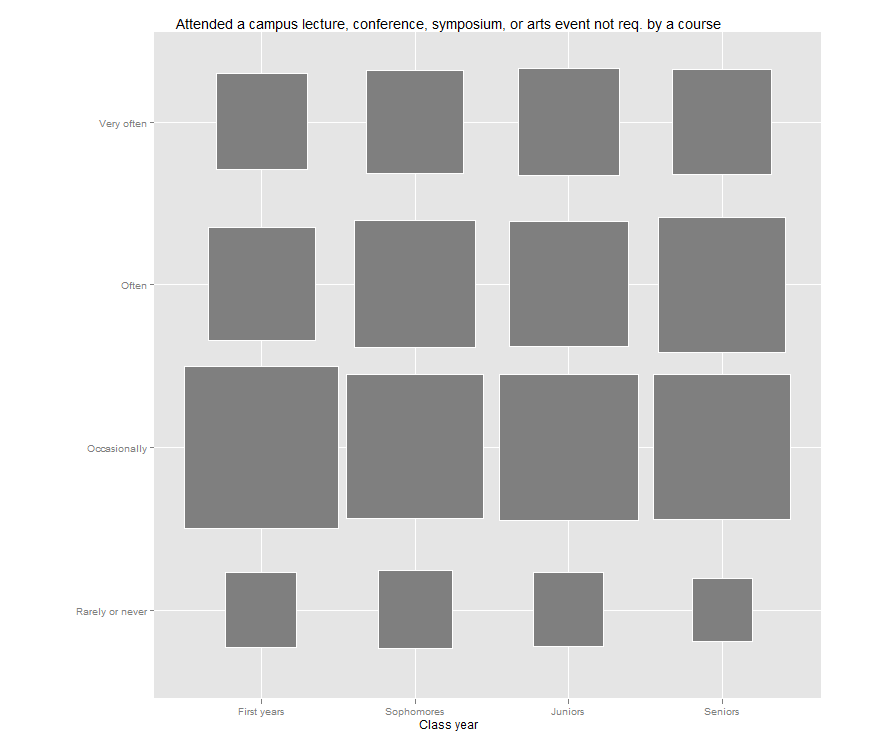
I finally had the chance to revisit an earlier post where I created a fluctuation plot for a recent survey item about the frequency of class discussion. This item is a part of an array of items that asks about the frequency (using the familiar “Rarely or never-Occasionally-Often-Very often” scale) during the academic year of a variety of activities often associated with student engagement. I created fluctuation plots for the whole set of items and put them into the photo gallery below. Like the plot from the previous post, these show the percentage of responses by category, by class year. Click anywhere on the gallery image below and you can use the arrows to flip through the items. Instructions on how to create these in R can also be found in the earlier post.